

— Detroit local visibility growth
Turn weak Google Maps zones into local growth.
Your business may rank near the office and disappear only a few miles away. Candela maps where valuable prospects can—and cannot—find you, then strengthens your Google Business Profile, local pages and authority signals to help more of the right customers call.
BUILT FOR HIGH-VALUE LOCAL BUSINESSES
HOME SERVICES
LAW FIRMS & LEGAL SERVICES
HEALTH & WELLNESS
PROFESSIONAL SERVICES
MULTI-LOCATION BRANDS
— The cost of being invisible
Customers cannot choose you if Google does not show you.
Google Maps results change with the searcher’s location. One ranking checked from your office can look encouraging while hiding entire neighborhoods where competitors receive the call first. Heatmaps reveal the real coverage pattern so marketing decisions are based on markets—not guesswork.

01
You lose calls without knowing it
Prospects search in a weak zone, see competing businesses first and contact them before ever discovering you.

02
Marketing decisions become guesswork
Without a geographic view, it is difficult to know which service, page or location deserves attention first.

03
Competitors build an unfair head start
Every month they stay more visible, they collect more clicks, calls, reviews and local authority—making the gap harder to close.
— What Candela does about it
Measure the market. Fix the gaps. Expand qualified visibility.
Candela turns a field of colored points into a managed local growth strategy. We define valuable markets, measure priority searches, improve the connected profile, page, listing and authority signals, then rescan comparable areas to show what moved and what should happen next.

01
Map the markets that matter
Measure visibility neighborhood by neighborhood for the services, practice areas, procedures and project types with real commercial value.

02
Find the visibility gaps
Find where competitors are being shown while your business is overlooked, then prioritize the gaps most likely to cost qualified calls.

03
Build local relevance
Improve Google Business Profile categories and services, original service or location pages, listings, internal links and legitimate local authority signals.

04
Measure the movement
Rescan consistent geographic points, explain what changed and focus the next month on the services and zones with the greatest opportunity.
ACTUAL CLIENT SEARCH SNAPSHOTS
Real businesses. Real searches. Visible local coverage.
Explore actual local search snapshots across garage door services, audiovisual rentals, insulation services and electrical construction. Client identities are withheld. The fourth example is a client not using Candela’s local SEO service; these are separate snapshots, not a before-and-after comparison.
Garage Door Services
90 of 95 scan points marked “Good” (95%).
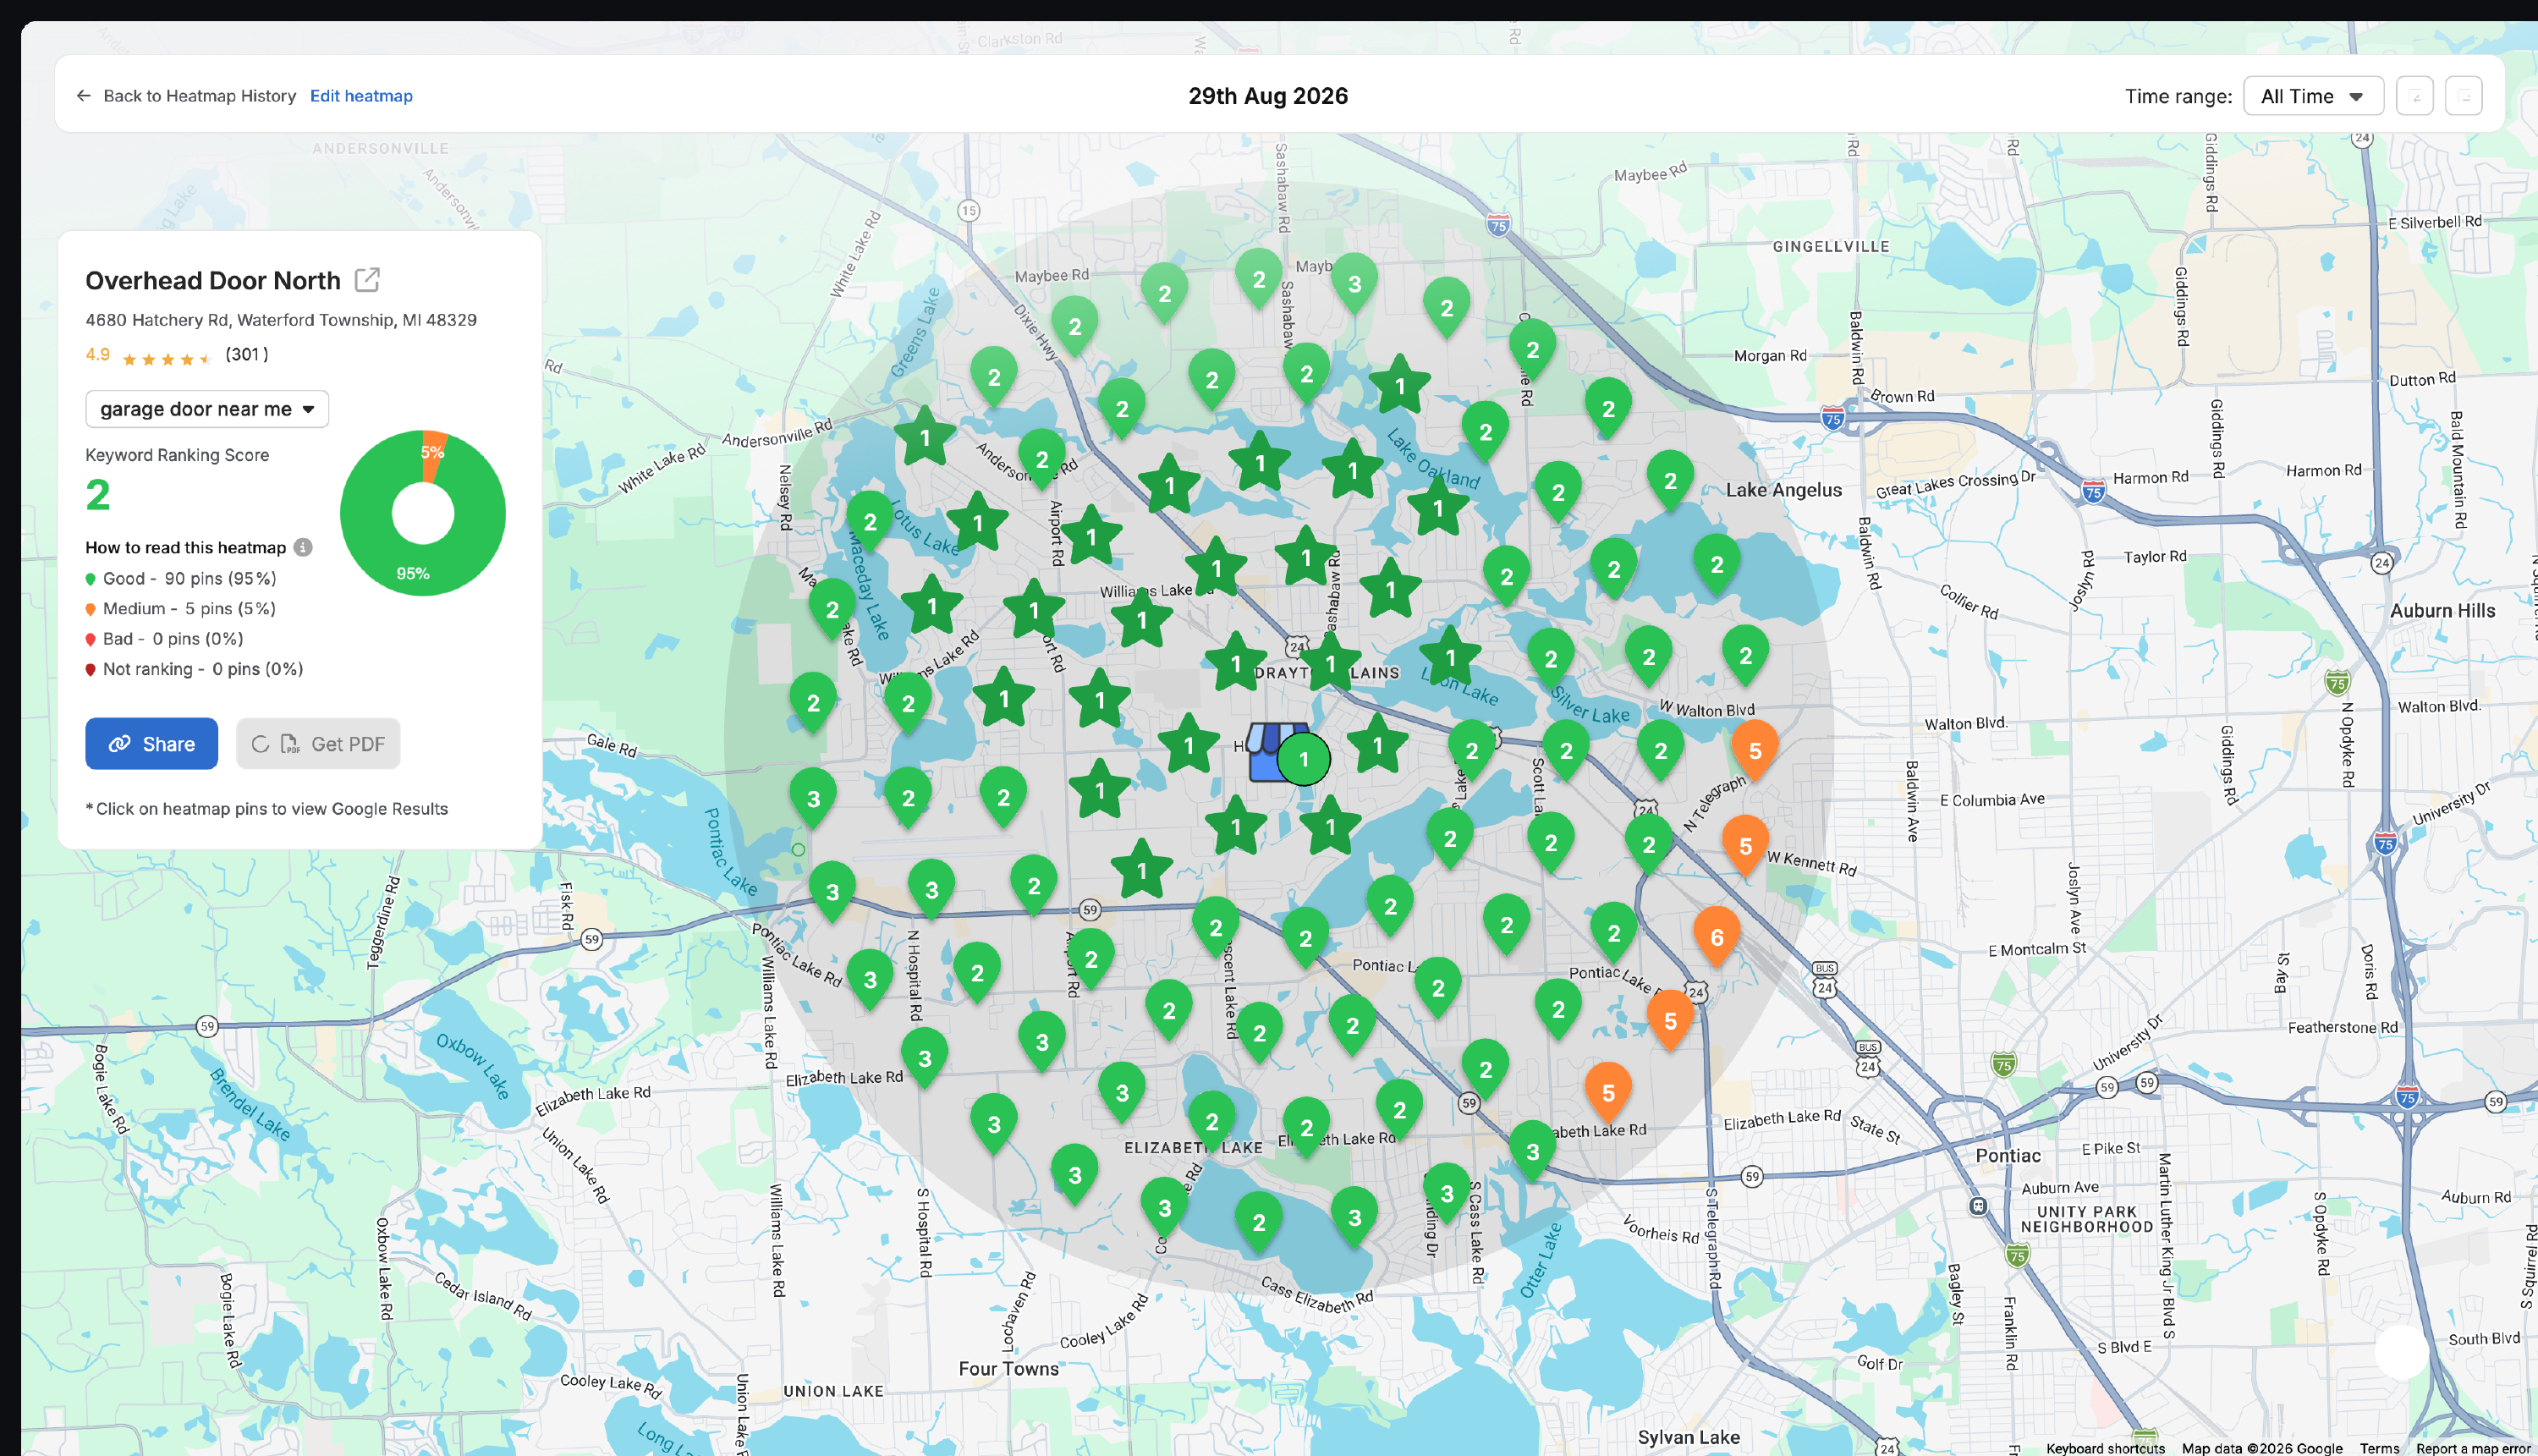
The report shows broad green coverage, with five points marked “Medium.” This helps distinguish a strong local footprint from the remaining pockets that deserve attention.
Audiovisual Rentals
36 of 39 scan points marked “Good” (92%).
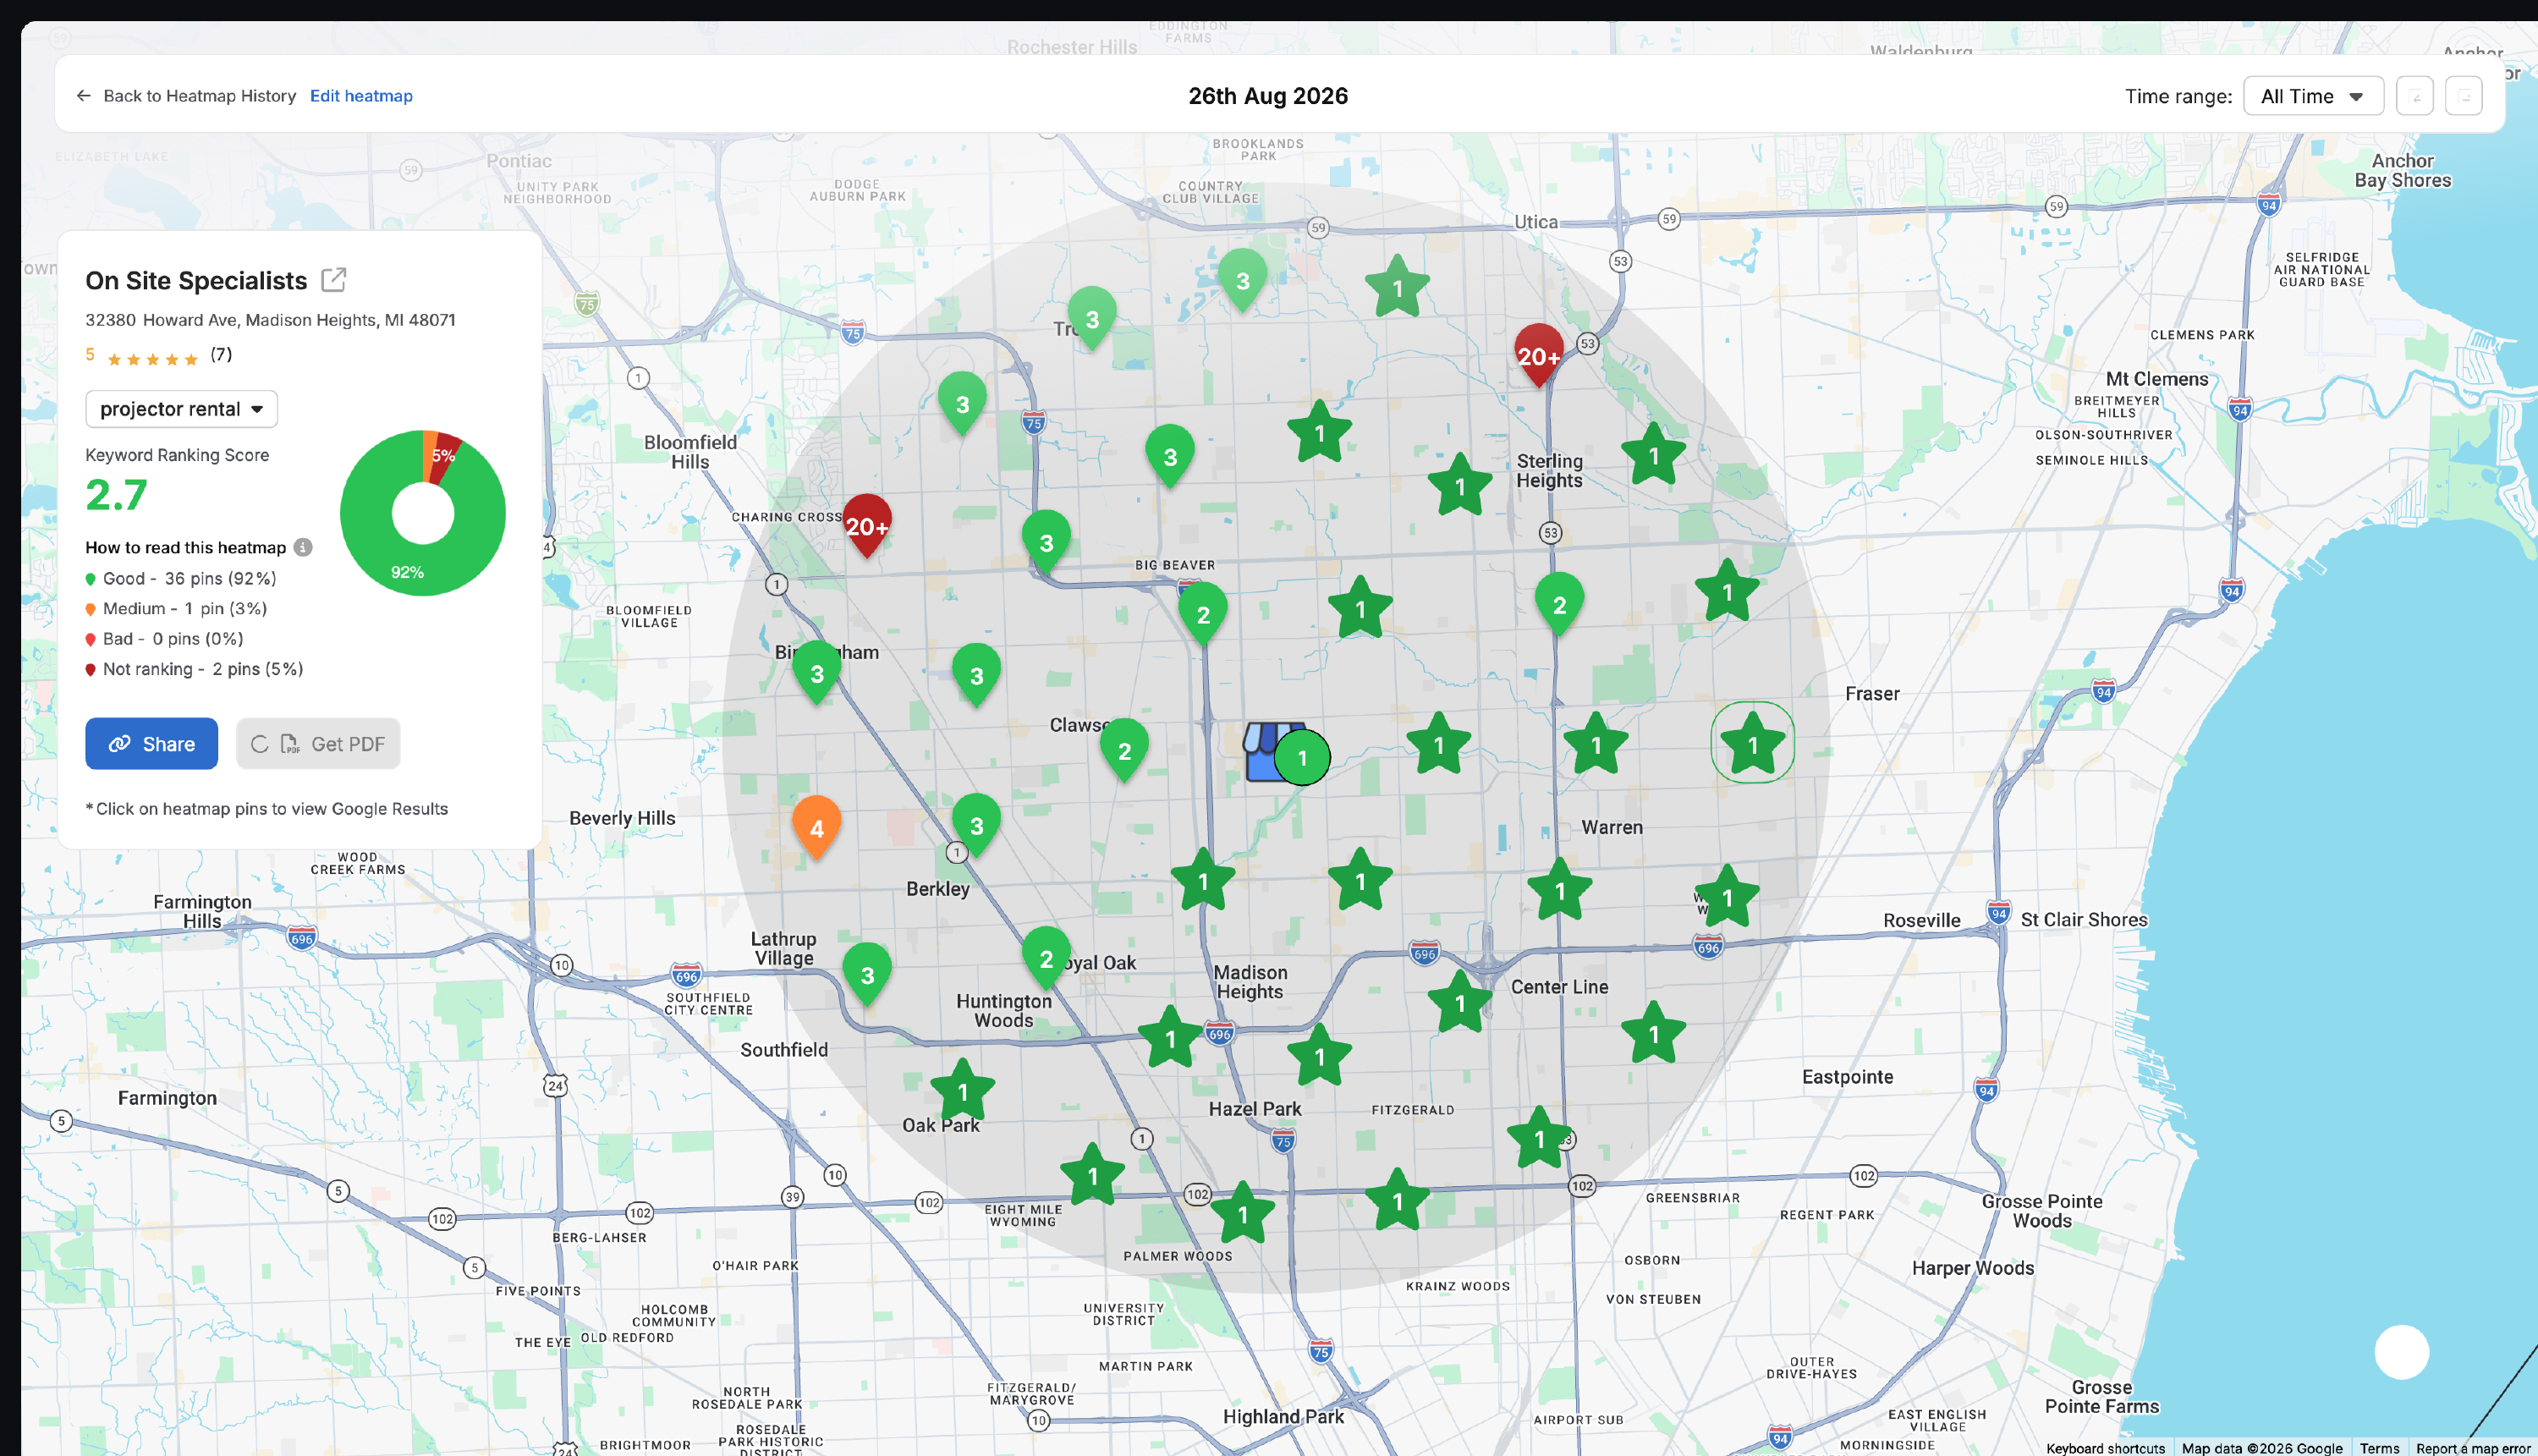
Strong coverage does not mean every neighborhood performs equally. This scan also contains one “Medium” point and two “Not ranking” points—specific places to investigate rather than treating the entire market as one result.
Insulation Services
67 of 95 scan points marked “Good” (71%).
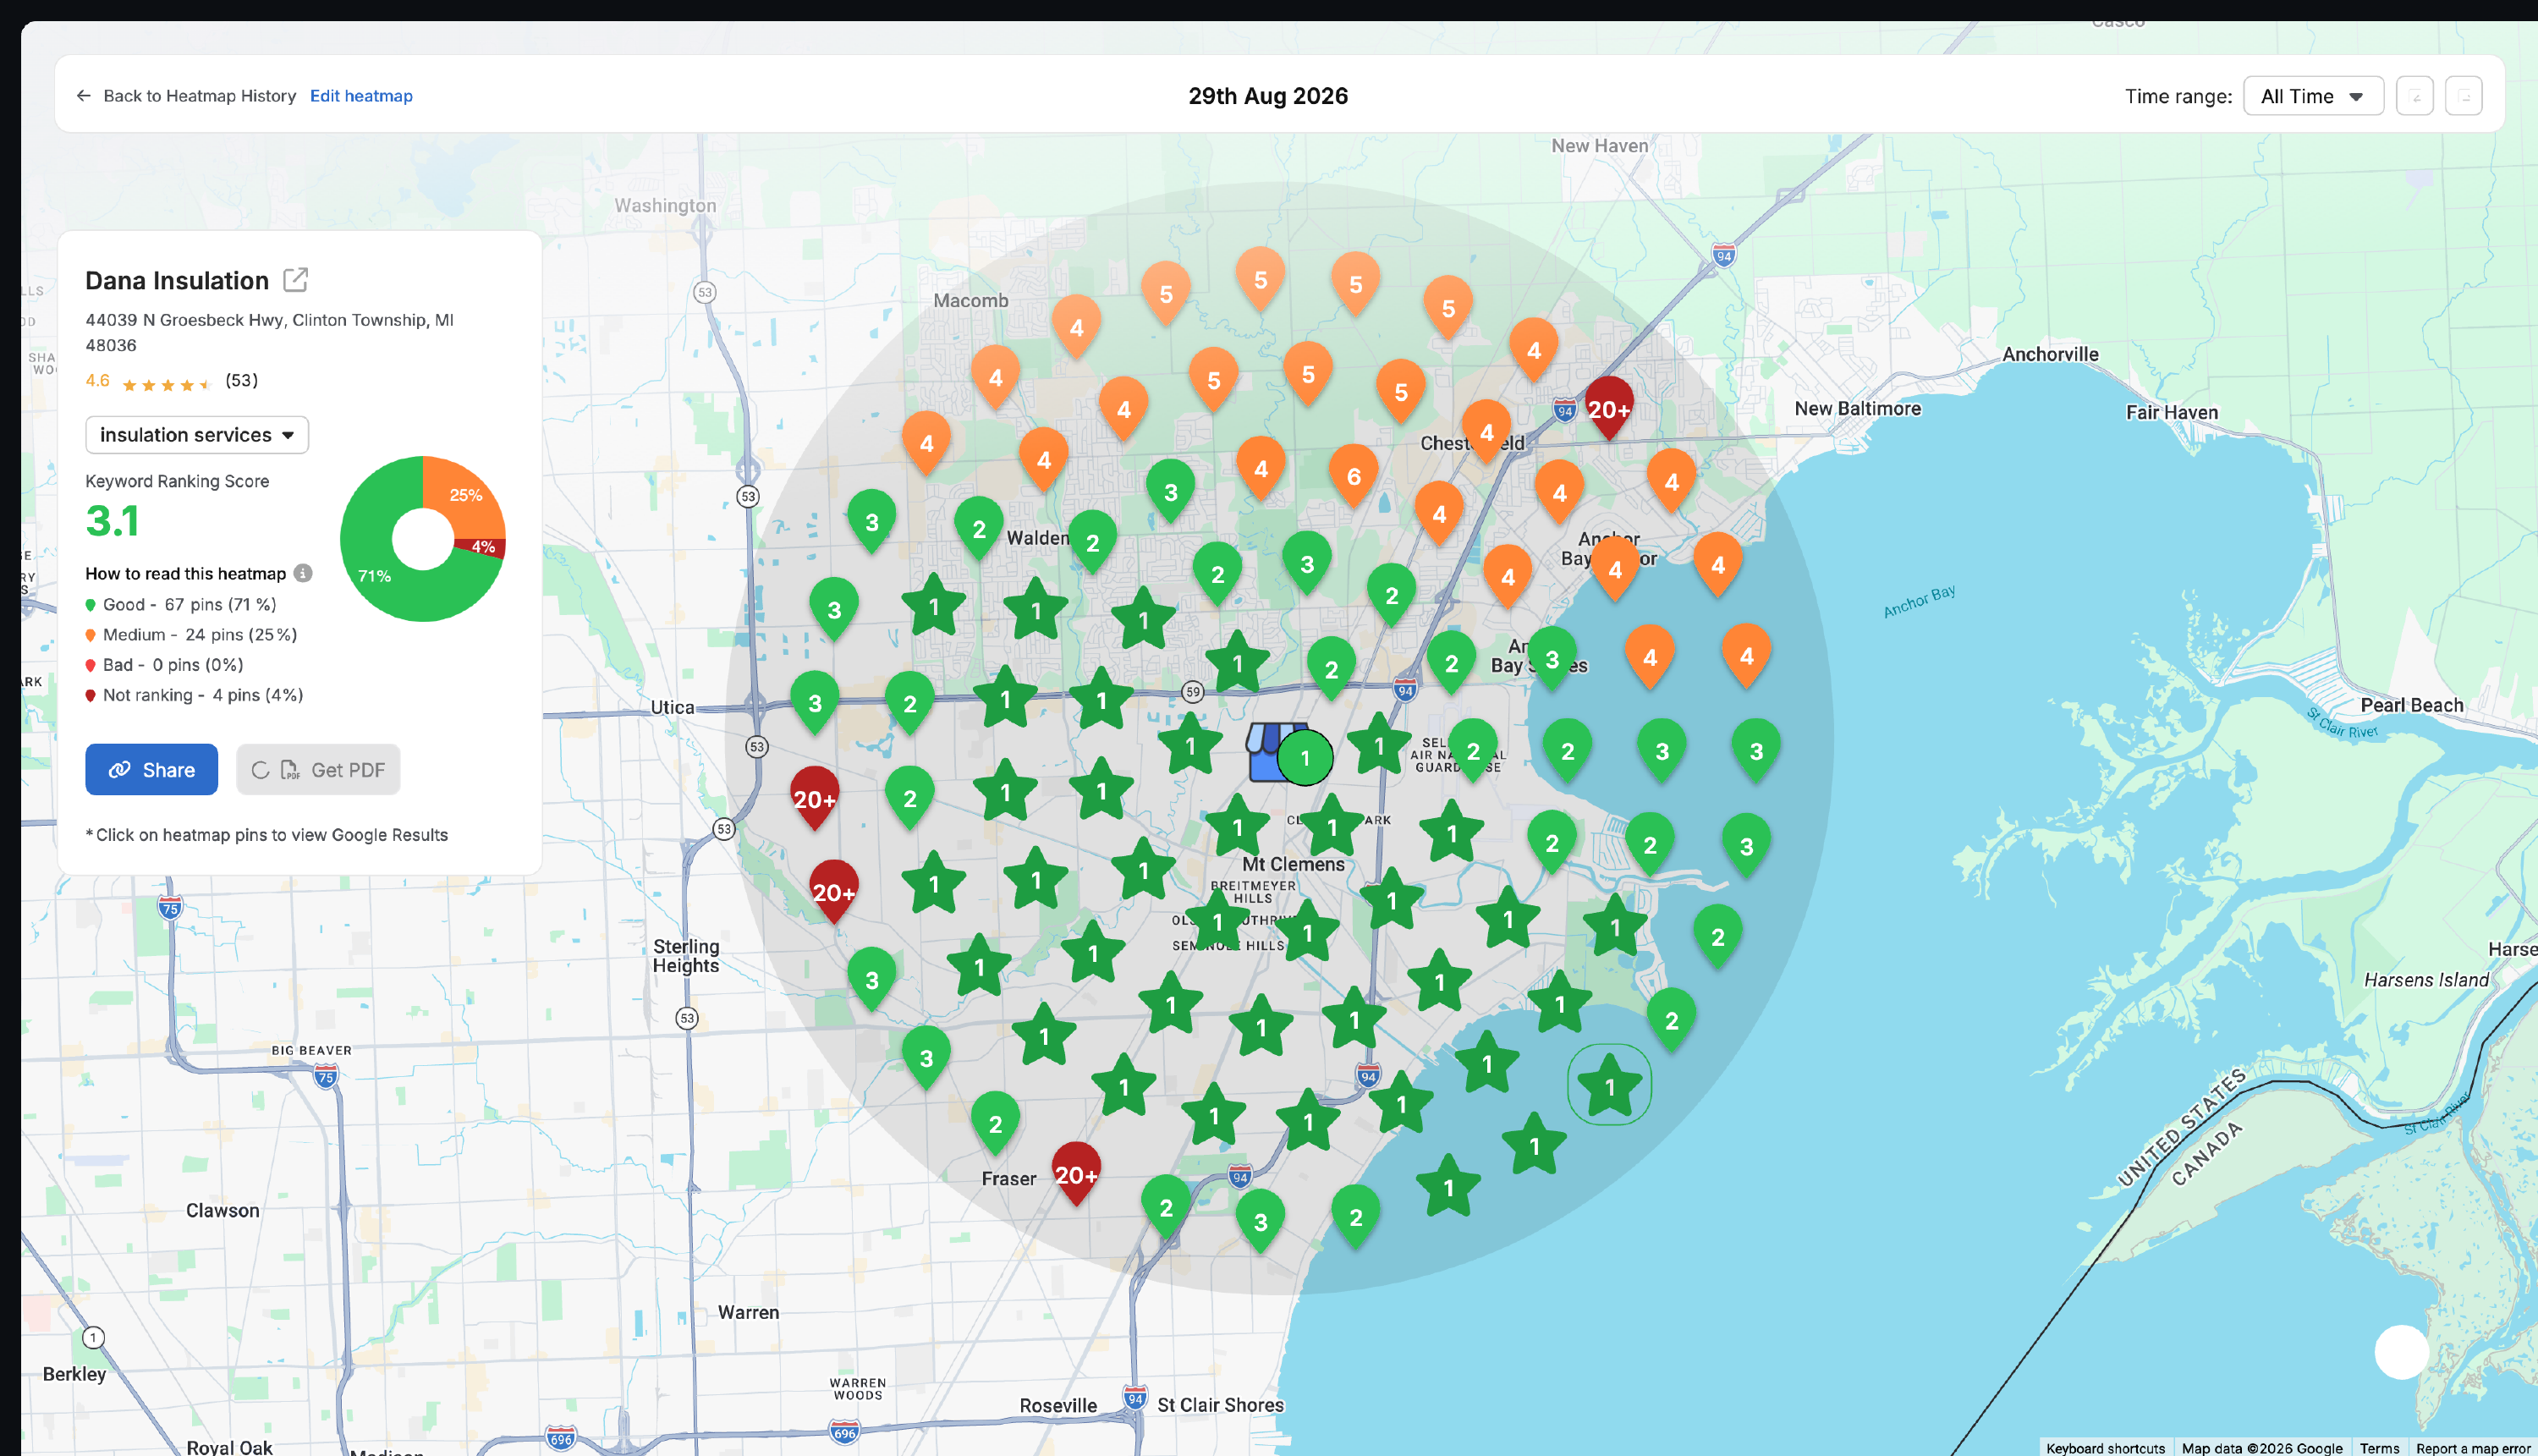
The scan shows a strong core alongside 24 “Medium” points and four “Not ranking” points. Mixed coverage helps prioritize where additional service relevance and local-authority work may be worth evaluating.
Electrical & Utility Construction
94 of 95 scan points marked “Bad” or “Not ranking.”
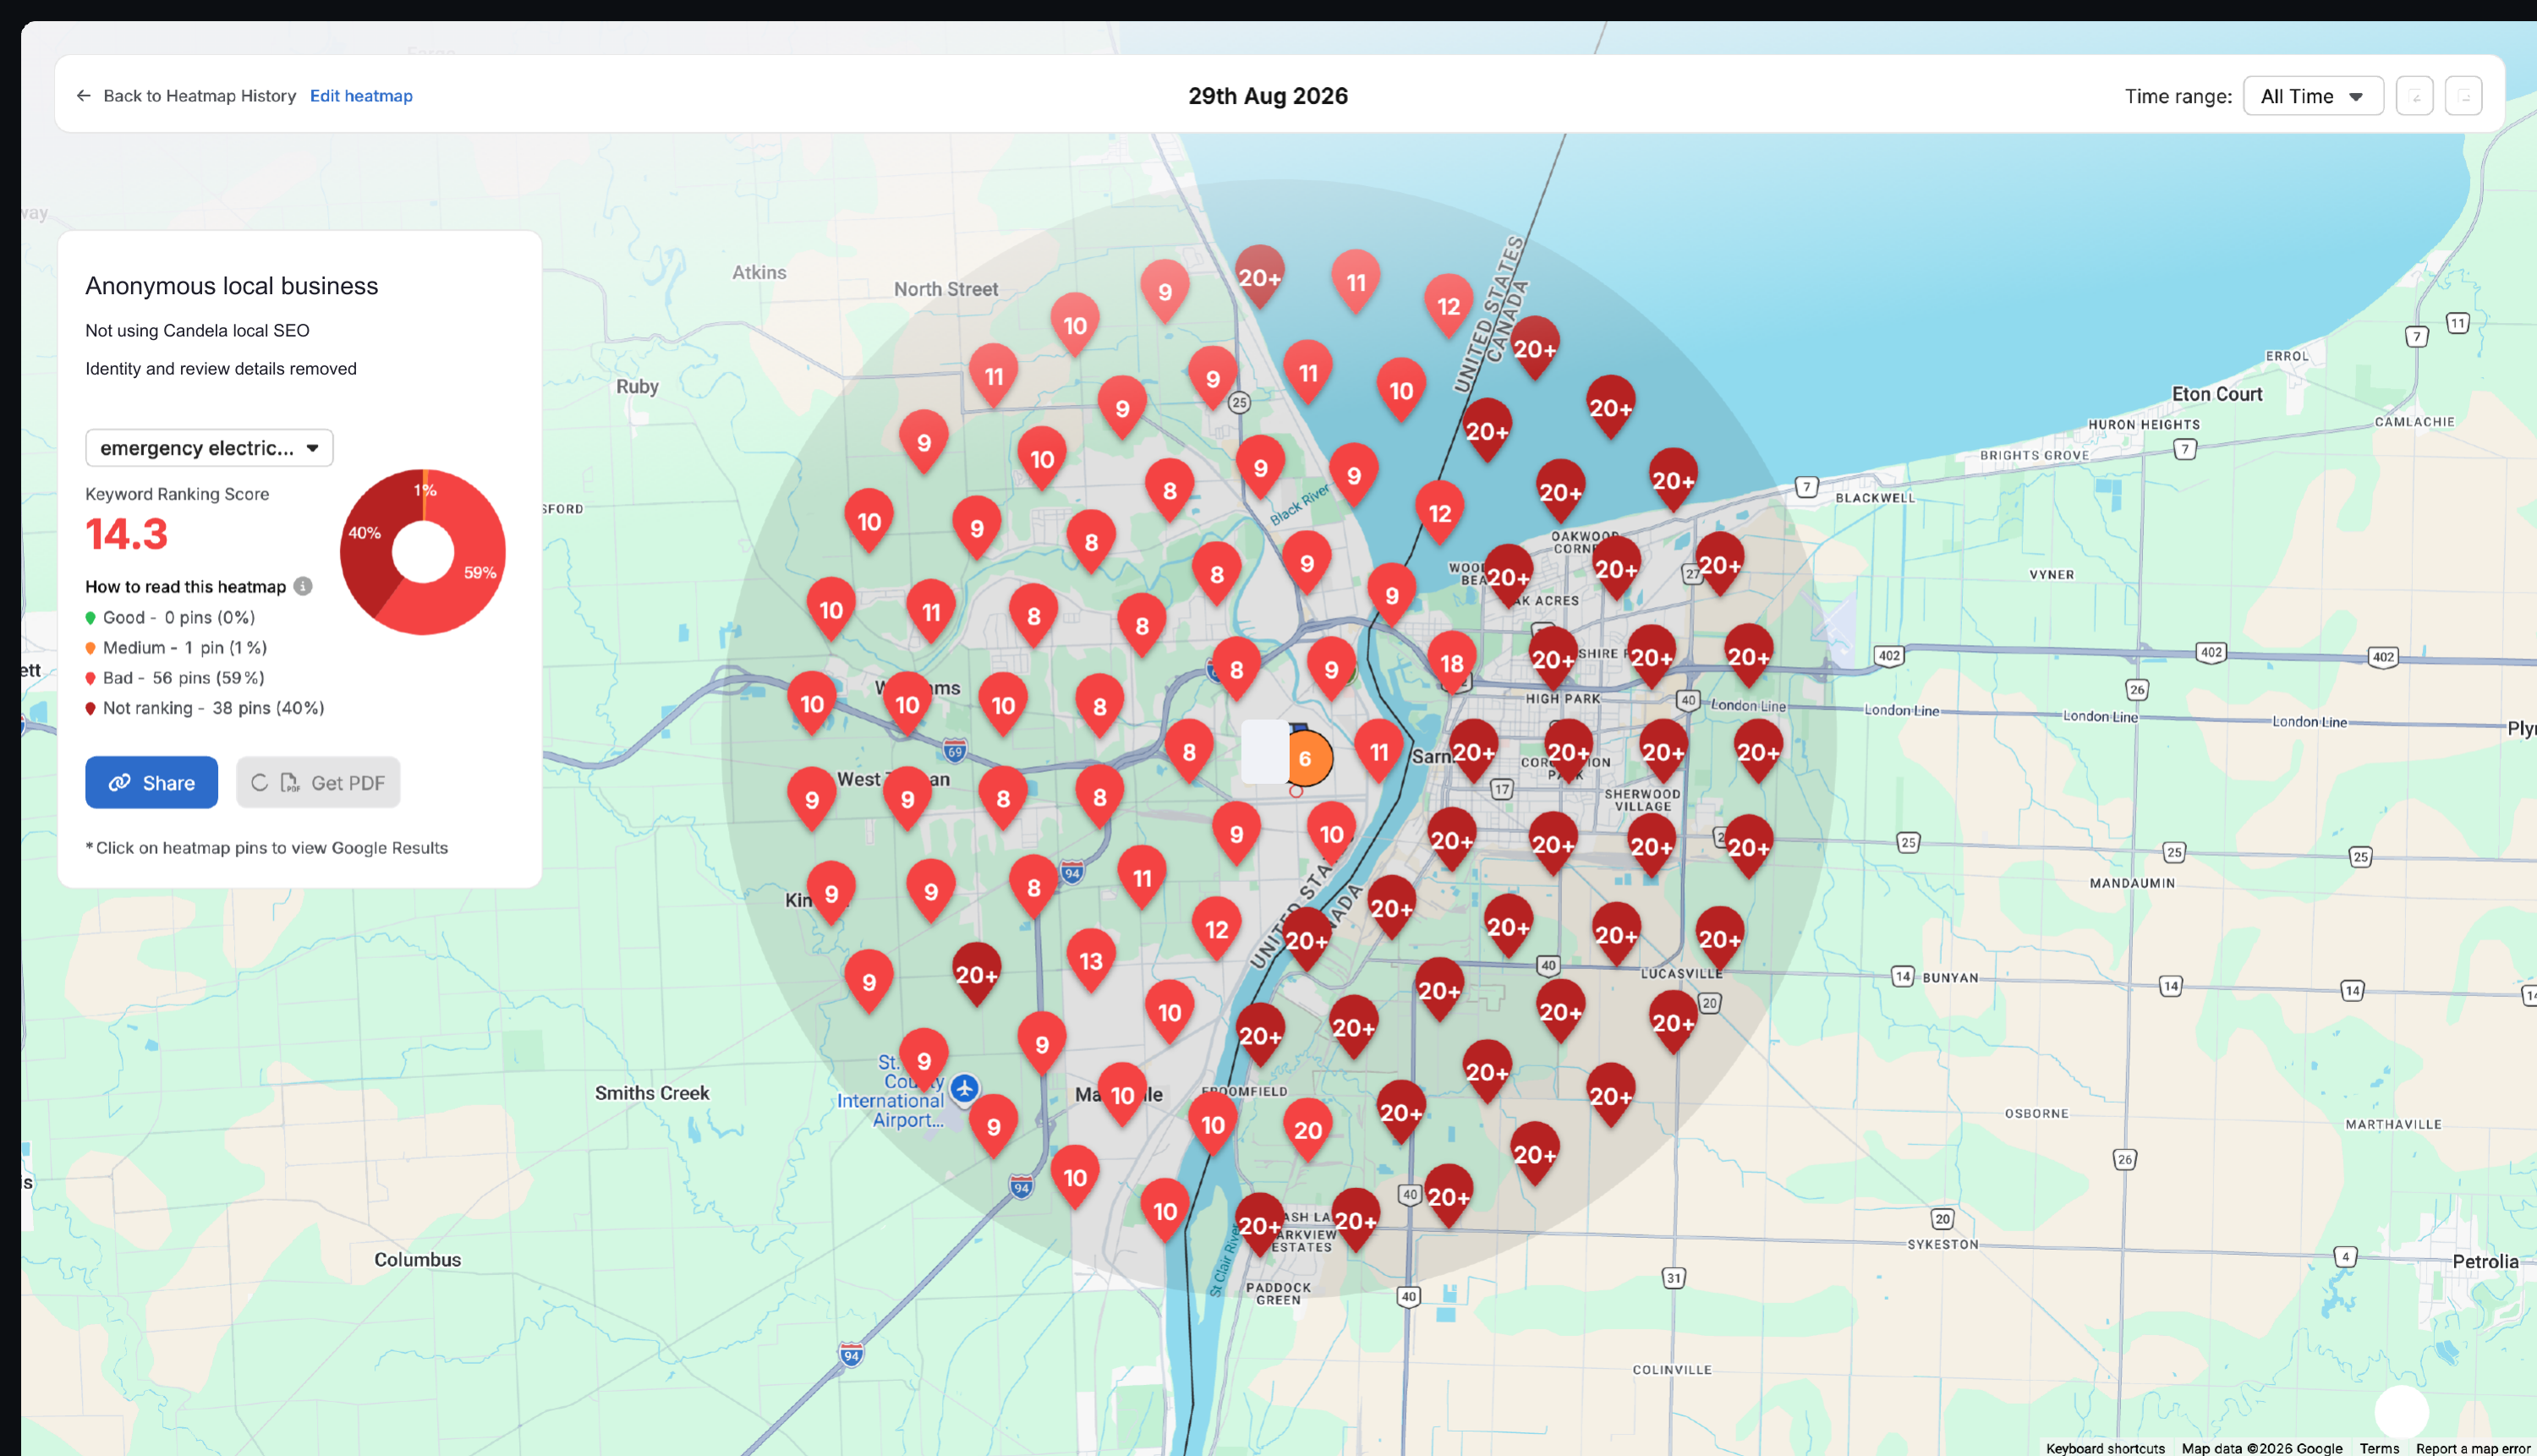
This client was not using Candela’s local SEO service at the time of the scan. The report shows one “Medium” point, 56 “Bad” points and 38 “Not ranking” points. It illustrates how much of a market can remain hard to reach—and why mapping visibility is a useful first step. This is not a Candela service result, a before-and-after comparison, or proof of what caused the rankings.
How to read these examples: each numbered point represents the reported position for the selected search at that location. “20+” is shown as “Not ranking” by these reports; it does not mean the business is absent from every Google result. “Good” and “Medium” are the report’s own classifications. These are different businesses, searches, dates and scan areas—not a before-and-after comparison. They do not establish revenue gains or guarantee future rankings.
YOUR LOCAL VISIBILITY SNAPSHOT
What would your business’s map look like?
Your reputation may be strong—but can prospects find you across the neighborhoods you want to serve? Request a local visibility scan to see where your business appears, where competitors show up instead, and which areas deserve attention first.
Start with your business name, website, priority service and target area. Candela will use the conversation to clarify the search and market to assess.
Request my local visibility scan ↗— What your business gets
More visibility. More trust. More chances to win the call.
The heatmap is the diagnostic—not the service. Candela manages the monthly work that makes your business clearer to Google, more credible to prospects and easier to contact across the markets you want to win.

01
A stronger Google Business Profile
Align categories, services, descriptions, photos, updates and conversion paths so Google understands what you offer and prospects can act with confidence.

02
A map of missed opportunity
See the neighborhoods where competitors are being shown while your business is being overlooked.

03
Pages that support valuable searches
Give Google and prospects useful, original information about the services and markets you want to win.

04
A more active business profile
Keep important services, proof and updates visible when prospects compare local options.

05
Consistent information everywhere
Reduce conflicting business details that weaken confidence and local search relevance.

06
More trust—or more authority
Generate and manage reviews, or apply that effort to local content, Q&A, citations and authority building.

07
Geographic progress you can understand
Compare heatmaps over time and see where coverage expanded, held or declined—along with the next action Candela recommends.
08
More qualified local opportunities
Help more of the right clients, patients and project owners discover your business when they are actively searching—and make the next step easy.
— Straightforward monthly plans
Choose how aggressively you want to expand local visibility.
Every plan covers one business location and includes specific monthly work. The difference is how many markets Candela targets and whether reputation or authority building is included.

Local Foundation
Best for a business that needs to fix weak local visibility in one focused market.
$795 / month
WHAT YOU RECEIVE
✓ See exactly where you rank with one monthly heatmap scan
✓ Track up to 3 searches tied to your highest-value services
✓ Build 1 original service or location page each month
✓ Publish 2 Google Business Profile posts each month
✓ Correct and strengthen your Google Business Profile
✓ Monitor business-name, address and phone consistency
✓ Receive a plain-English monthly progress report

MOST POPULAR
Local Growth
Best for a business that also needs more visible trust to convert searchers into calls.
$1,095 / month
WHAT YOU RECEIVE
✓ Everything included in Local Foundation
✓ Automatically ask satisfied clients for reviews by email or SMS
✓ Give customers a direct review link and QR code
✓ Monitor new reviews so nothing important is missed
✓ Receive professionally drafted review responses
✓ Replace review work with additional local-authority work when reviews are unsuitable

Market Leader
Best for a competitive market where faster expansion and broader coverage matter.
$1,595 / month
WHAT YOU RECEIVE
✓ Scan rankings twice monthly to spot movement sooner
✓ Track up to 8 valuable service-and-market targets
✓ Build 2 original service or location pages each month
✓ Publish 4 Google Business Profile posts each month
✓ Strengthen citations and local authority signals
✓ Review priorities with Candela in a monthly strategy call
✓ Choose the Review System or Local Authority track
3-month minimum commitment
Each plan requires a three-month minimum commitment. After the initial three months, service continues month to month and may be canceled. If the client cancels and later restarts the service, the $495 setup fee is charged again. Plans cover one business location; custom multi-location pricing is available.

— If reviews influence the decision
Help your online reputation match the quality of your work.
Candela makes it easier for satisfied clients to leave feedback, monitors new reviews, and helps your business respond professionally—giving future prospects more confidence to call.
OR

— If reviews are restricted or less important
Use that effort to strengthen local authority instead.
Candela replaces the review work with additional profile content, citation improvements, local questions and answers, and authority-building activities that support visibility.
— Common questions
Good strategy starts with clarity.
Why isn’t my business showing up on Google Maps?
Incomplete or inaccurate profile information, verification issues, distance from the searcher, and strong competition can all affect visibility. Candela checks the profile and scans your target neighborhoods to distinguish a missing listing from weak rankings, then prioritizes the issues your business can address.
Why do competitors rank above my business locally?
Google considers relevance, distance and prominence—not simply who does the best work. Candela compares your visibility with competing businesses and strengthens the profile, service information and local authority that help prospects find and evaluate you. No agency can guarantee a position above every competitor.
Why does my Google Maps ranking change by location?
Distance from the person searching influences local results. You can appear near your office and be much less visible a few miles away. A heatmap compares the same search across multiple locations, so Candela can identify where to focus work. Local SEO cannot eliminate the effect of distance.
How can my business get more calls from Google?
Start by making your business easier to find for the right services and easier to choose once someone finds it. Candela connects visibility improvements with clearer service pages, credible proof and straightforward contact options. The goal is more relevant inquiries—not simply more map views. Call volume also depends on demand, competition and your response process.
How much do local SEO services cost in Detroit?
Candela’s plans for one business location start at $795 per month for Local Foundation. Local Growth is $1,095 per month, and Market Leader is $1,595 per month. Each requires a three-month minimum, then continues month to month. Restarting canceled service incurs a $495 setup fee. Custom multi-location pricing is available. Your visibility scan helps determine which plan fits your market and priorities.
How quickly may results appear?
Some profile and content improvements may appear relatively quickly, while meaningful ranking movement commonly takes several months.
Why can rankings not be guaranteed?
Proximity, relevance, competition, prominence, search behavior and Google updates all affect results. No reputable agency can guarantee a specific ranking.
How do location pages remain original and useful?
Every page is built around a real service, market need and visitor decision—not merely a city-name swap.
What if reviews are unsuitable for our industry?
Choose the Local Authority track. Candela replaces review-system work with additional GBP content, citations, local Q&A and authority-building activities.
Why is there a three-month minimum?
Local visibility requires a baseline, implementation, rescanning and enough time to evaluate movement.
What happens if we cancel and restart later?
Restarting requires a new baseline and setup, so the $495 setup fee is charged again.

— Stop guessing where you rank
Find the local searches your competitors are winning from you.
Begin with a visibility scan and see where prospects can find you, where you disappear, and which improvements deserve attention first.
Show me my visibility gaps ↗